Monitoring Dual ISP Status with SonicWall SNMP and Next.js
TL;DR
If you just want to see if your ISPs are up or down without logging into your SonicWall admin interface, this project gives you a simple real-time dashboard. It queries your SonicWall firewall via SNMP and displays the status of each WAN interface, including uptime, IP addresses, and link speeds. Check out the GitHub repository to get started.
The Motivation: Living Off the Grid (Sort Of)
I live in Borrego Springs, a small desert community in Southern California. It’s a beautiful place—surrounded by Anza-Borrego Desert State Park, with dark skies perfect for stargazing and temperatures that remind you why air conditioning exists.

However, living in a remote desert location comes with its challenges, and reliable internet is one of them. My primary ISP (Zito Media) goes down more often than I’d like to admit. Sometimes it’s for a few minutes, sometimes for hours. When you work from home as a software developer, this is more than just an inconvenience—it’s a productivity killer.
The Dual ISP Setup
To combat this unreliability, I’ve set up a dual ISP configuration using a SonicWall firewall with load balancing capabilities. Here’s my setup:
Primary ISP: Zito Media (Cable)
- Generally faster speeds when it works
- Unfortunately, has frequent outages in my area
Backup ISP: Starlink Mini ($5/month Plan)
- Starlink offers a $5/month “Mobile - Regional” plan that’s perfect for backup purposes
- It doesn’t provide the full Starlink speeds, but it keeps my IOT devices connected and provides basic internet when Zito goes down
- The low monthly cost makes it an excellent insurance policy against outages
The SonicWall firewall handles the load balancing between these two connections. When one ISP goes down, traffic automatically fails over to the other. In theory, this works great. In practice, I often found myself wondering which ISP was actually up or down when things felt slow.
The Problem: Checking ISP Status is Painful
When my internet feels sluggish, my first thought is often: “Is Zito down again?” To find out, I’d have to:
- Log into the SonicWall admin interface
- Navigate to Device → Settings
- Find the Network section
- Drill down to Failover & Load Balancing
- Look at the status of each WAN interface group
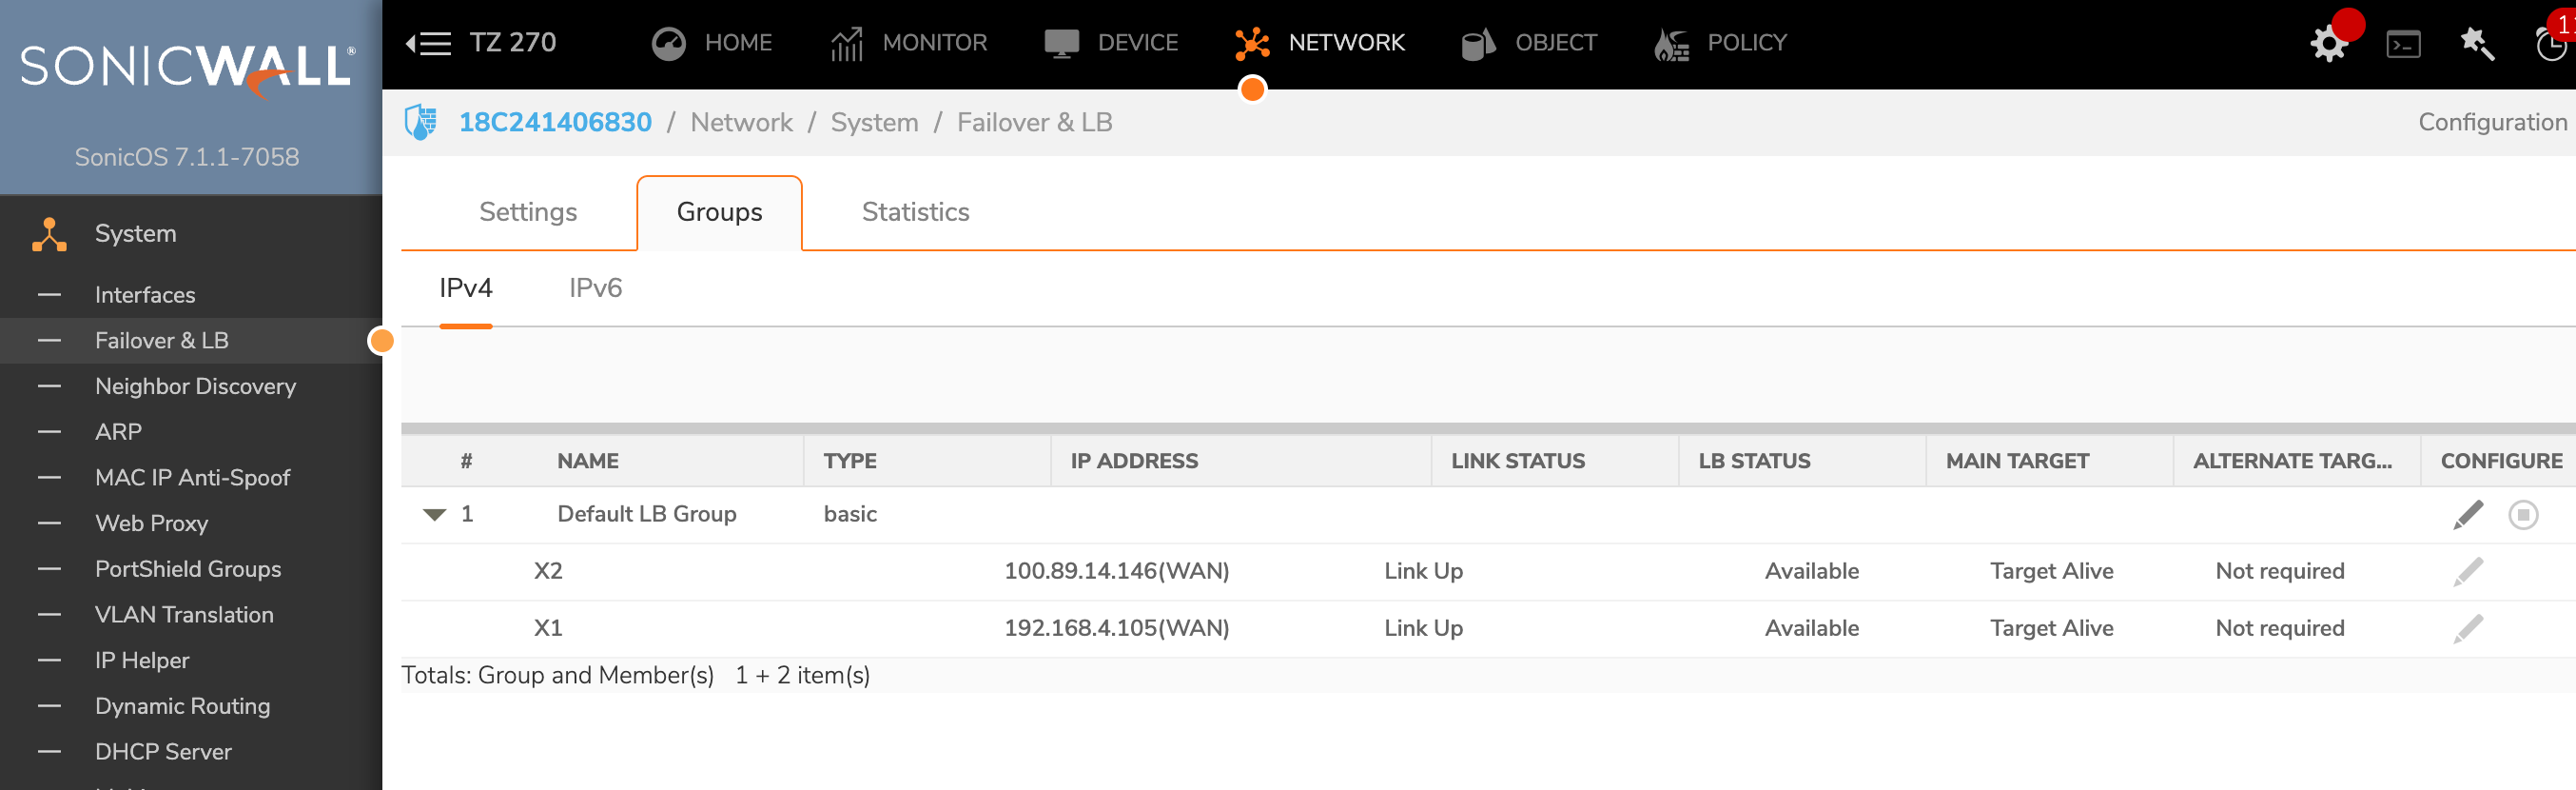
This process takes several minutes and requires remembering the admin credentials, dealing with session timeouts, and clicking through multiple menus. What I really wanted was a simple dashboard I could glance at to see the status of both ISPs immediately.
The Solution: SNMP Monitor Dashboard
That’s why I built the SNMP Monitor ISPs project. It’s a Next.js application that queries your SonicWall firewall using SNMP (Simple Network Management Protocol) and displays the status of your WAN interfaces in a clean, auto-refreshing dashboard.
Key Features
- Real-time status: See which ISPs are up or down at a glance
- Uptime/downtime tracking: Know how long each connection has been in its current state
- IP address display: Verify your public IP addresses
- Link speed information: See the connection speeds for each interface
- Event logging: Track historical state changes
- Auto-refresh: Dashboard updates automatically (configurable interval)
How It Works
The project supports two methods for fetching data from your SonicWall:
Option 1: REST API
The SonicWall API provides detailed information but requires admin credentials and can interfere with active admin sessions.
Option 2: SNMP (Recommended)
SNMP is the recommended approach because:
- No admin credentials needed
- Doesn’t interfere with admin sessions
- Standard monitoring protocol
- Includes traffic statistics
The application runs as a Next.js server that periodically queries your SonicWall’s SNMP interface and serves a web dashboard showing the current status.
Architecture Overview
┌─────────────────┐     SNMP Query     ┌─────────────────┐
│   Next.js App   │ ──────────────────▶│   SonicWall     │
│   (Dashboard)   │ ◀────────────────── │   Firewall      │
└─────────────────┘     Response       └─────────────────┘
        │                                      │
        │                                      ├── WAN X1 (Zito)
        │                                      └── WAN X2 (Starlink)
        ▼
   Web Browser
   (Auto-refresh)
Installation Guide
Prerequisites
- Node.js 18 or higher
- A SonicWall firewall with SNMP enabled
- Network access to your SonicWall from where you’ll run the dashboard
Step 1: Enable SNMP on Your SonicWall
- Log into your SonicWall admin interface
- Navigate to Device → Settings → SNMP
- Enable SNMP
- Add your monitoring host’s IP address
- Set a community string (default is usually “public”)
- Ensure UDP port 161 is accessible
Step 2: Clone and Configure the Project
# Clone the repository
git clone https://github.com/pkellner/snmp-monitor-isps.git
cd snmp-monitor-isps

# Install dependencies
npm install

# Copy the example environment file
cp .env.example .env
Step 3: Configure Environment Variables
Edit your .env file with your SonicWall details:
# Use SNMP method (recommended)
FETCH_METHOD=snmp

# Your SonicWall's IP address
SNMP_HOST=192.168.1.1

# SNMP community string (set this on your SonicWall)
SNMP_COMMUNITY=public

# Which interfaces to monitor (comma-separated)
SONICWALL_WAN_INTERFACES=X1,X2

# How often to refresh (in milliseconds)
NEXT_PUBLIC_REFRESH_MS=5000

# Friendly names for your ISPs (optional but recommended)
NEXT_PUBLIC_ISP_NAME_X1=Zito Media
NEXT_PUBLIC_ISP_NAME_X2=Starlink
Step 4: Run the Dashboard
For development:
npm run devFor production:
npm run build
npm start
The dashboard will be available at http://localhost:3000
Running on a Raspberry Pi
One of the best ways to run this dashboard is on a Raspberry Pi. I run mine on a Raspberry Pi 5, which keeps the dashboard accessible 24/7 without needing to keep a desktop computer running.
Docker Deployment
The project includes Docker support for both Intel/Apple Silicon Macs and ARM-based Raspberry Pi systems:
# Build and run with Docker Compose
docker compose up -d --build
This creates a container that will automatically restart if your Pi reboots, ensuring you always have access to your ISP status dashboard.
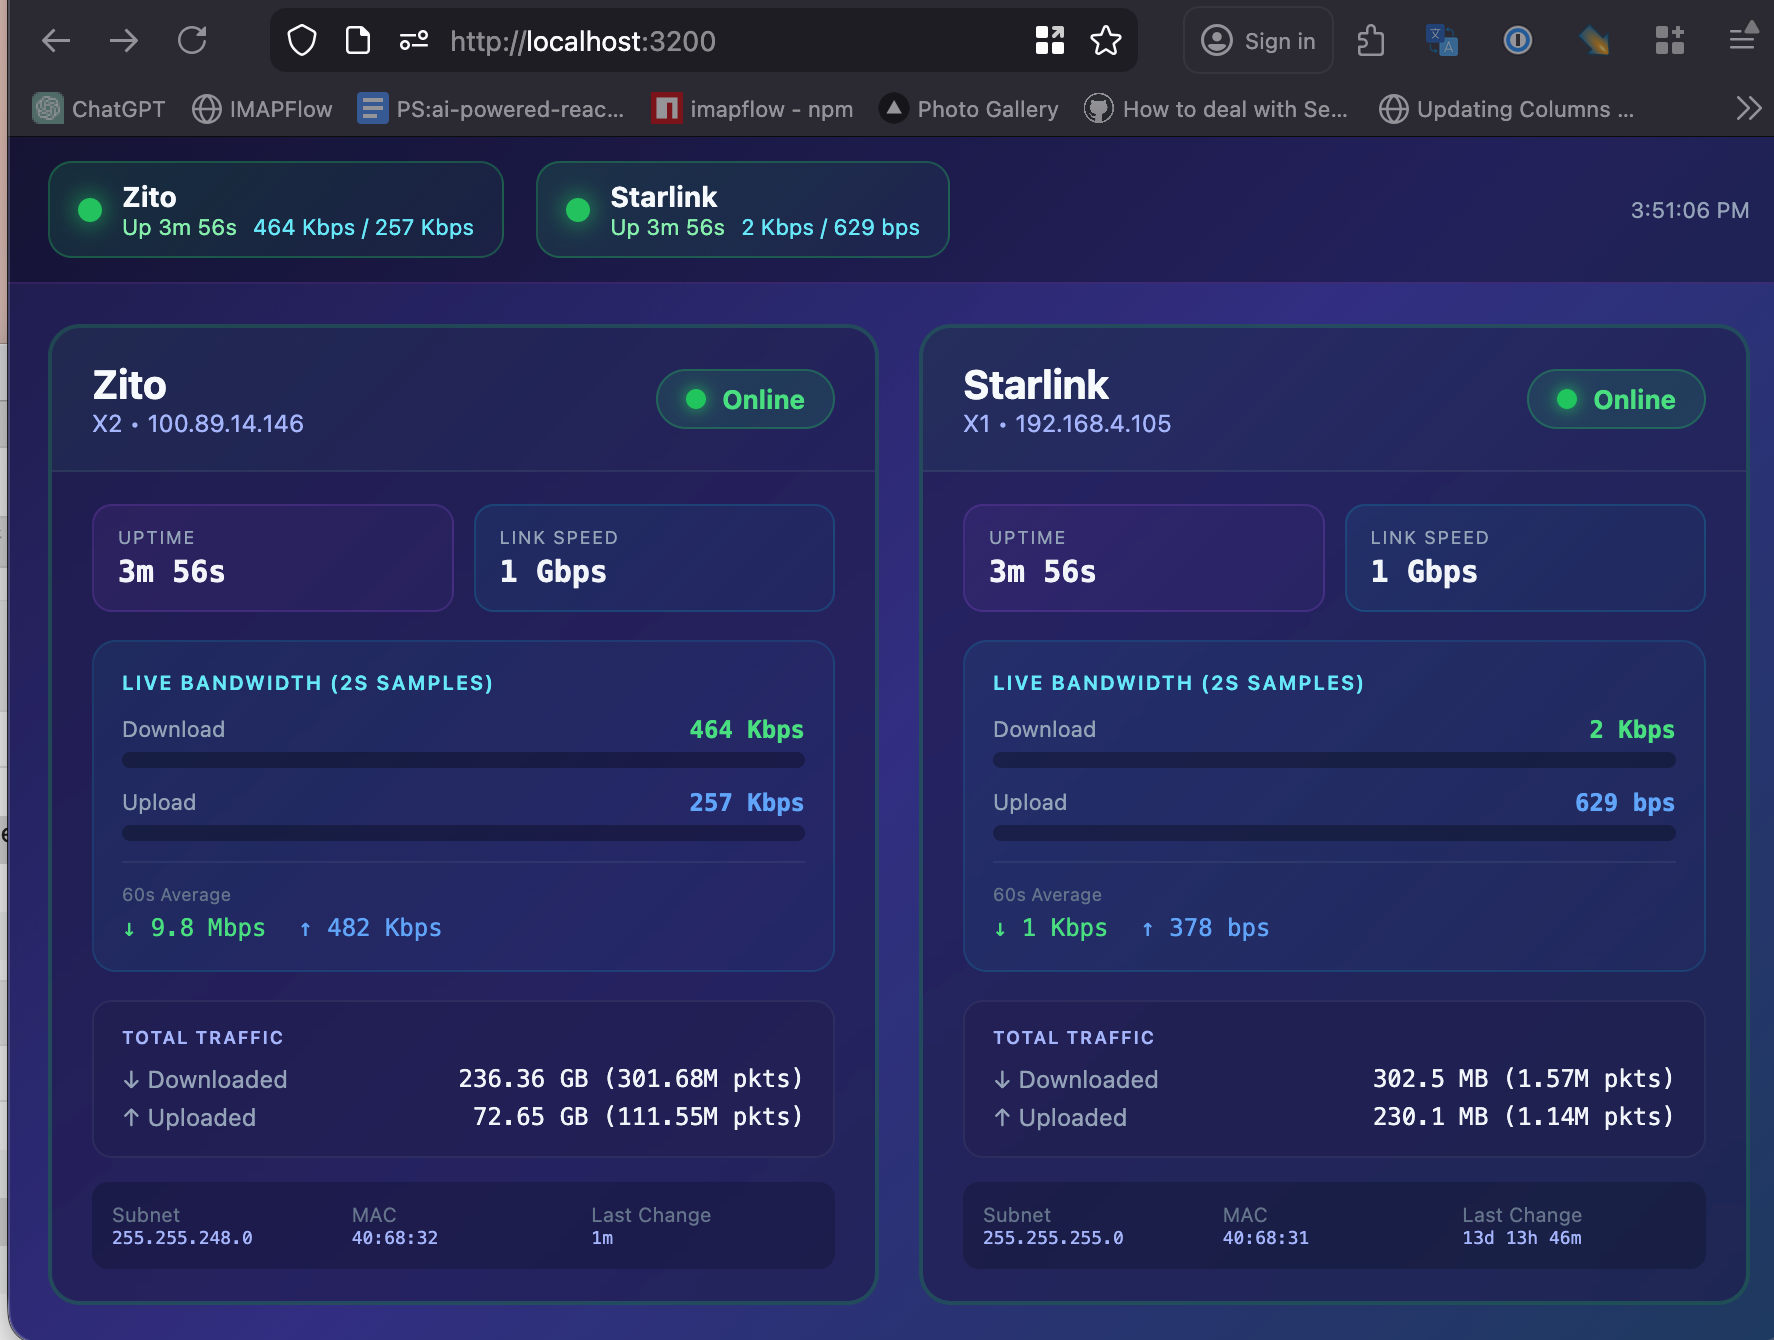
Reading the Dashboard
Once running, the dashboard shows you:
- Interface Status: A clear UP or DOWN indicator for each WAN interface
- Duration: How long the interface has been in its current state
- IP Address: The current public IP assigned to each interface
- Link Speed: The connection speed (useful for verifying you’re getting expected speeds)
- Event Log: A history of recent state changes
When Zito goes down, I immediately see it on the dashboard without having to log into anything. I can also see how long it’s been down and when it comes back up.
Troubleshooting
SNMP Not Working?
- Verify SNMP is enabled on your SonicWall
- Check that UDP port 161 is not blocked
- Ensure your monitoring host’s IP is in the SNMP allowed hosts list
- Test with:
snmpwalk -v2c -c public YOUR_SONICWALL_IP
Interface Names Not Found?
Interface names are case-insensitive (X1, x1, etc.), but make sure they match what your SonicWall calls them. Check your SonicWall’s interface configuration for the exact names.
Can’t Connect to SonicWall?
Make sure the machine running the dashboard has network access to your SonicWall’s management IP address.
Why I Built This
This project scratches a personal itch. Living in a remote area with unreliable internet, I needed a quick way to see what was happening with my connections. Now, instead of spending several minutes logging into the SonicWall admin interface, I can glance at a browser tab and immediately know the status of both my ISPs.
If you have a similar dual-ISP setup with a SonicWall firewall and want instant visibility into your connection status, I hope this project helps you as much as it’s helped me.
Resources
- GitHub Repository - Full source code and documentation
- SonicWall SNMP Documentation - Official SonicWall SNMP setup guides
- Next.js Documentation - For customizing the dashboard
Have questions or improvements? Feel free to open an issue or PR on the GitHub repository.