TechEd 2007, Orlando
Visual Studio Debug/Trace Tricks From the Learning Center With Steve Carol
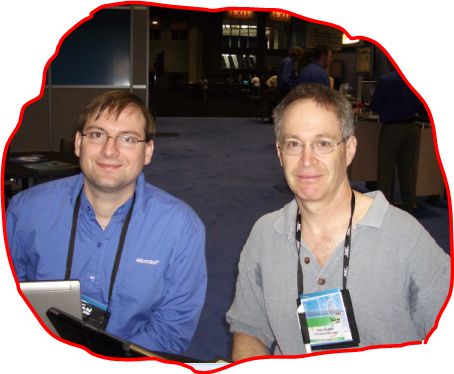
I love these meetings! I have to admit that I come not for the sessions, but for the learning center. At the moment I'm working on a .net Silverlight application and I've got lots of problems. What I do is put the mark $$$ in my code in all the places where I'm having problems. I trek over to the learning center area and sit down with a Microsoft engineer who is willing to tolerate me. Today, the guy was Steve Carroll who I believe is a manager on the visual studio performance team. Score! Big time help, and some bonuses also. Steve didn't really know anything about WPF
or Silverlight but knows c# very very well. I asked him if he was a c# wizard at the start and he said no. He was very wrong about that.
So, here we are, all smiles.
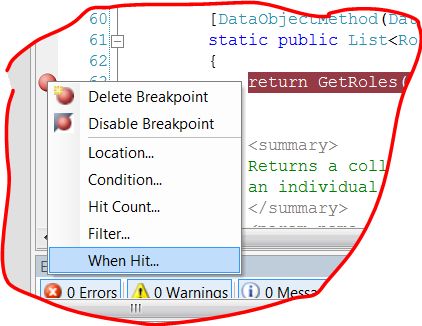
So, not only did I get huge help, but Steve showed me some very cool tricks. Specifically how to turn trace output on in the debugger. Basically, you go to the debug point you set, right mouse button on it and you get this menu, you choose "When Hit".
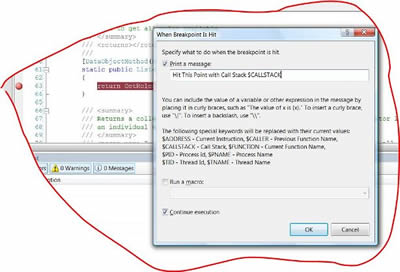
Then, you get the following dialog where you put stuff you want to get displayed when the point gets hit (without stopping). Basically, it logs it all to the output window. You can put your own variables in parenthesis, or any text you want.
Awesome feature! Now, I've given a little back after learning so much. Four and half days left!